Sherman Financial
  • Services
    • Financial Planning
    • Small Business
    • Pricing
    • Resources
  • About
    • Bio
    • Philosophy
  • Contact
  • Articles

Sherman's Insights

Tax Season and the Risk/Return Paradox

3/10/2017

0 Comments


Market Outlook

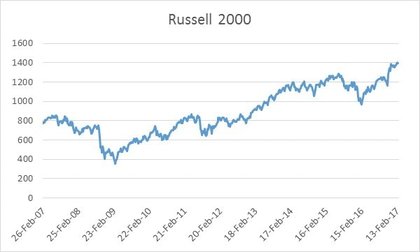
​The start of 2017 has seen new highs for major stock indices. The Dow, Nasdaq, Russell and S&P 500 have all posted records.
Picture
While no one can predict the future, I will be watching a number of events in March to see where the market is headed.

The Federal Reserve Board meets starting March 14. With the Fed pointing to an interest rake hike "fairly soon," another interest rate hike is expected the first half of the year. 

I will also bet watching jobs numbers. The Bureau of Labor's Monthly Unemployment Report, comes out March 10. Unemployment remains low at 4.8%. Last month, in spite of a slight increase in unemployment, the market responded positively to the continued trend of strong jobs numbers.

Lastly, the Consumer Confidence Index is released March 28. The index combines consumer's business and employment outlooks. The index reached a 15 year high in December, but dipped in January. 
​

Tax Season

The time for 2016 Taxes is here. An organized approach can turn a stressful process into a straightforward transaction with the help of a tax preparer.

Begin the process by collecting all of your tax documents. Forms like your W-2 or 1099 should arrive by mail. You will also want to gather any records relating to donations, investments or education. Consider putting all your documents in a single folder or envelope as you receive them. 

Schedule your tax appointment early. Preparing your taxes before the due date gives you time to assemble missing documents to maximize your deduction or plan for a larger than expected tax bill. Filing early also means an early refund. The IRS aims to issue refunds for electronically filed returns in less the three weeks.

Filing your taxes is a great time to review your financial health and evaluate your goals. Its also a great time to discuss how tax planning fits into your overall financial plan.

State and Federal income taxes are due April 18, 2017. Schedule an appointment with me today. 

Schedule a Tax Appointment

Understanding Risk (and why performance alone is not my first concern)

A key component of any financial plan is risk management. Investors want to maximize returns while minimizing risk. While different funds may offer similar returns, differences in risk can mean one is a great investment, while another is not. Risk relates to return, and when comparing either a stock or mutual fund it is important to see return in comparison to relative risk measures. An active fund with a 15% return over the past year may seem great on the surface, however the return alone does not tell us how this 15% compares to other funds and the market overall.

I often see client statements filled with only annual return graphs and figures. I want to give a full picture - that's why I include risk and return metrics in my reviews.  I look at a number of indicators including, Alpha, Beta, R-Squared, the Sharpe Ratio, and Standard Deviation when recommending investments to ensure they are appropriate for an individual's client risk tolerance and fit within their broader financial plan. The risks of stocks, mutual funds and other similar securities are measured with statistics. The actual performance of a security is compared to a bench mark to see if the investment performed as expected. 

Different investments have different benchmarks. Some are measured against "risk free returns," often U.S. Treasury Bills. Others are designed to match the performance of a specific index such as the S&P 500 or the market as a whole. 


Measures of Risk

Picture
Alpha: Compares a fund's expected return against it's actual returns. A positive alpha means a fund performed better than predicted. Investors consider alpha a measure of valued added by a fund's manager. 

Beta: Measures a security's volatility (movement in price). A beta of 1.0 indicates a stock's price will move with the market. Above 1.0 a stock will be more volatile than the market. Below 1.0 less volatile.

R-Squared: Measures the performance of a security against its  benchmark index as a percent. R-squared values are not a measure of performance, but a measure of correlation. A security with a high r-squared percent will perform similarly to its benchmark index.

Sharpe Ratio: A risk-adjusted calculation of return. The greater the Sharpe Ratio, the better the returns, relative to risk. The Sharpe Ratio compares the return of security against the return of U.S. Treasury Bills. 

​Standard Deviation: Indicates how widely a security's returns have varied from their average over a period of time. Standard deviation is useful for predicting a range of future returns based on historical performance.

Go further in depth:
Investopedia "What are Risk Measures"
​Morningstar "Ratings and Risk"

Example:

First Eagle's Global Fund (FESGX) invests in a mix of U.S. and foreign stocks. Focused on long term growth, this fund is bench marked against the MSCI World Index, an index of global equities. With historically strong returns, FESGX seems like a strong investment. A more thorough analysis shows it may not be the best place for your money.

Alpha: FESGX has a five-year alpha of -1.21. While the fund has posted good returns, it's alpha shows that returns were lower than expected. In short, investing in the bench mark index would have yielded higher returns.

Beta: At 1.17, the beta of FESGX suggests the fund is 17% more volatile than the MSCI Index. While this volatility offers the potential for greater returns, its also means greater exposure to market downturns.

R-Squared: A high R-squared value, 89.02%, indicates that the performance of FESGX is strongly correlated to the MSCI index. An investor would expect FESGX to closely follow changes in the price of the MSCI index. 
​

​Sharpe Ratio: A sharpe ratio of 0.83 indicates that FESGX has under performed given its risk. Investors typically look for sharpe ratios greater than 1. Ratios greater than 2 are considered very good, and greater than 3, even better. 
​
Standard Deviation: FESGX has a high standard deviation of 8.21. A high standard deviation indicates volatile returns. An investment in a different fund with a lower standard deviation would yield more stable results. 


​

Recommended Reading

  1.  5 Mistakes to Avoid When Rebalancing a Portfolio: There are a few theories behind this. Gains in the stock market can affect the balance of your portfolio. How and when you choose to rebalance your portfolio is key to keeping your financial plan on track. For a more analytical approach, see Vanguard's research where they suggest a 5% figure.
  2. Warren Buffett's Annual Letter: Known for his classic investment strategy and focus on consumer staples, Warren Buffett's annual letter is reviewed by the New York Times.
  3. 2017 Federal Tax Calendar: A handy list of due dates for Federal Taxes in 2017. Especially useful if your tax situation involves more than a W-2 or 1099.
  4. Finally, for the uplifting article of the month: Scottish Schoolchildren Give Goldfish a Grand Viking Funeral - This may seem excessive for a goldfish, but there is a deeper aspect to this. If we can care so much about the lives of goldfish, how much more should we care for those people living around us?
0 Comments


Leave a Reply.

 © 2025 Sherman Financial, LLC
Disclaimer: 
Information on this website and blog do not involve the rendering of personalized investment advice. A professional advisor should be consulted before implementing any of the options presented. No content should be construed as legal or tax advice. Always consult an attorney or tax professional regarding your specific legal or tax situation.
Photo from smbuckley23
  • Services
    • Financial Planning
    • Small Business
    • Pricing
    • Resources
  • About
    • Bio
    • Philosophy
  • Contact
  • Articles